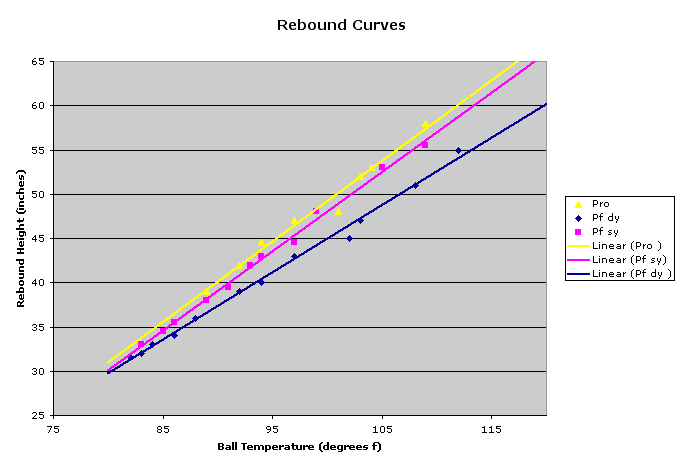
The results for 3 balls are shown in the graph below. The abbreviations are:

For background on what this graph shows, see Balls, Bounce, and Surface Temperature. A linear regression tend line has been added for each ball.
The Pointfore Single Yellow Dot tested close to the Pro. The Pointfore Double Yellow Dot has a rebound curve which falls further below the Pro as the ball temperature increases.
Note: this rebound test was done with a different drop height than the one used in Balls, Bounce and Surface Temperature.